Let’s set the scene. You have a Unity application. It goes smoothly in Unity Editor, but when built in WebGL, embedded into your web page, and feed up with real data, it starts to slow down. How to profile that ?
Using Chrome profiler
Long story short, run your app in Chrome, click F12->Performances->Record button. Play a few second with your app and stop recording. You end up with something like this:

Let’s zoom a bit on a single frame:

We have a few insights of what happen, but we end up with useless “wasm-function“.
How to have access to Unity’s code function names ?
Enable Symbols Generation
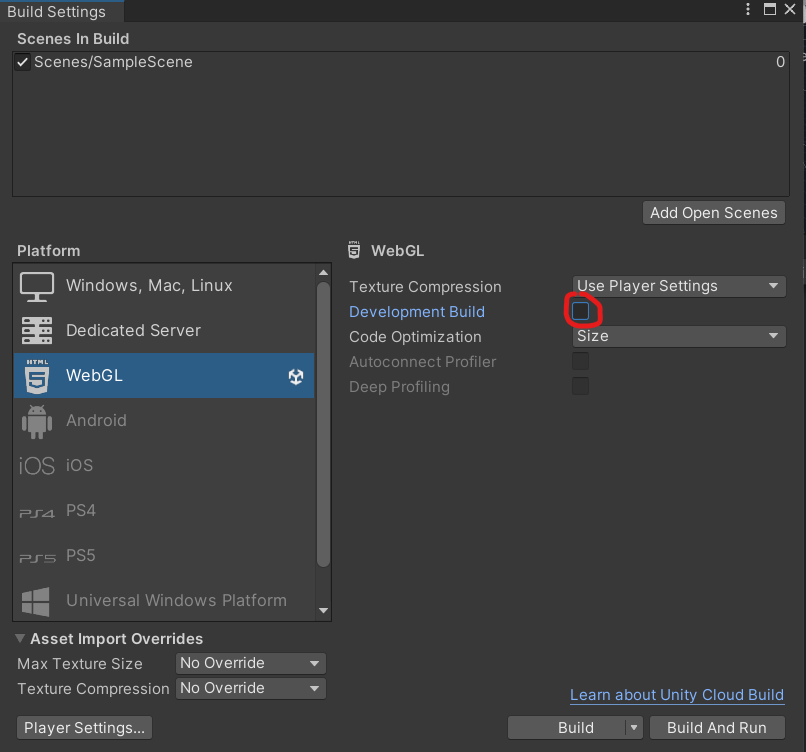
Going back to Unity, File->Build Settings, and check Development Built.
Build, run your app. If you are like me, you’ll end up with this errors:
Assertion failed: undefined
ERROR Error: Uncaught (in promise): TypeError: stackSave is not a function
...
Enable Symbols Generation !!!
It seems there is a bug, either in Unity 2023.1, either in emscripten, I’m not sure. After some research, it seems related to this issue.
Let’s try to work around this. Uncheck Development Built, as it doesn’t work. Create a script “BuildScript.cs” in your Asset/Editor folder, and copy/past this (adapt scenes and locationPathName to your case):
using UnityEditor;

public class BuildScript
{
#if UNITY_EDITOR
    [UnityEditor.MenuItem("Tools/BuildWebGL with Debug info")]
    public static void BuildWebGLWithDebugInfo()
    {
        UnityEditor.PlayerSettings.WebGL.emscriptenArgs = "-s DEMANGLE_SUPPORT=1";
        UnityEditor.PlayerSettings.WebGL.debugSymbolMode = WebGLDebugSymbolMode.Embedded;

        BuildPlayerOptions buildOptions = new BuildPlayerOptions();
        buildOptions.scenes = new[] { "Assets/Scenes/SampleScene.unity" };
        buildOptions.locationPathName = "build";
        buildOptions.target = BuildTarget.WebGL;

        BuildPipeline.BuildPlayer(buildOptions);
    }
#endif
}
Now, in Unity Editor, build your app using Tools->BuildWebGL with Debug info.
Profiling App
Go back to Chrome, F12->Performances->Record, zoom on a frame and…

Now, name of Unity’s function are visible. You can profile your code and understand what’s going on 😉

Leave a comment